


Decoding the General Surgery Match, the Effect of Applicant Characteristics, Preference Signals and Away Rotations on Match Success
*Jacob L. Kotlier 1, *Angela P. Mihalic 2
1Tufts University School of Medicine, Belmont, MA; 2UT Southwestern, Dallas, TX
Background: General surgery implemented a preference signaling program starting with the 2021-2022 application cycle which allowed applicants to signal their top five preferred programs. This research aims to describe the general surgery match and quantify the effects of signaling on the general surgery residency application process.
Study Design: This study relies on self-reported survey data from 2017-2024 from the Texas Seeking Transparency in Application to Residency database. Variables associated with receiving interviews and match success were analyzed using two-sided t-tests, Chi-squared tests, variance ratio testing and receiver operating characteristic (ROC) analysis.
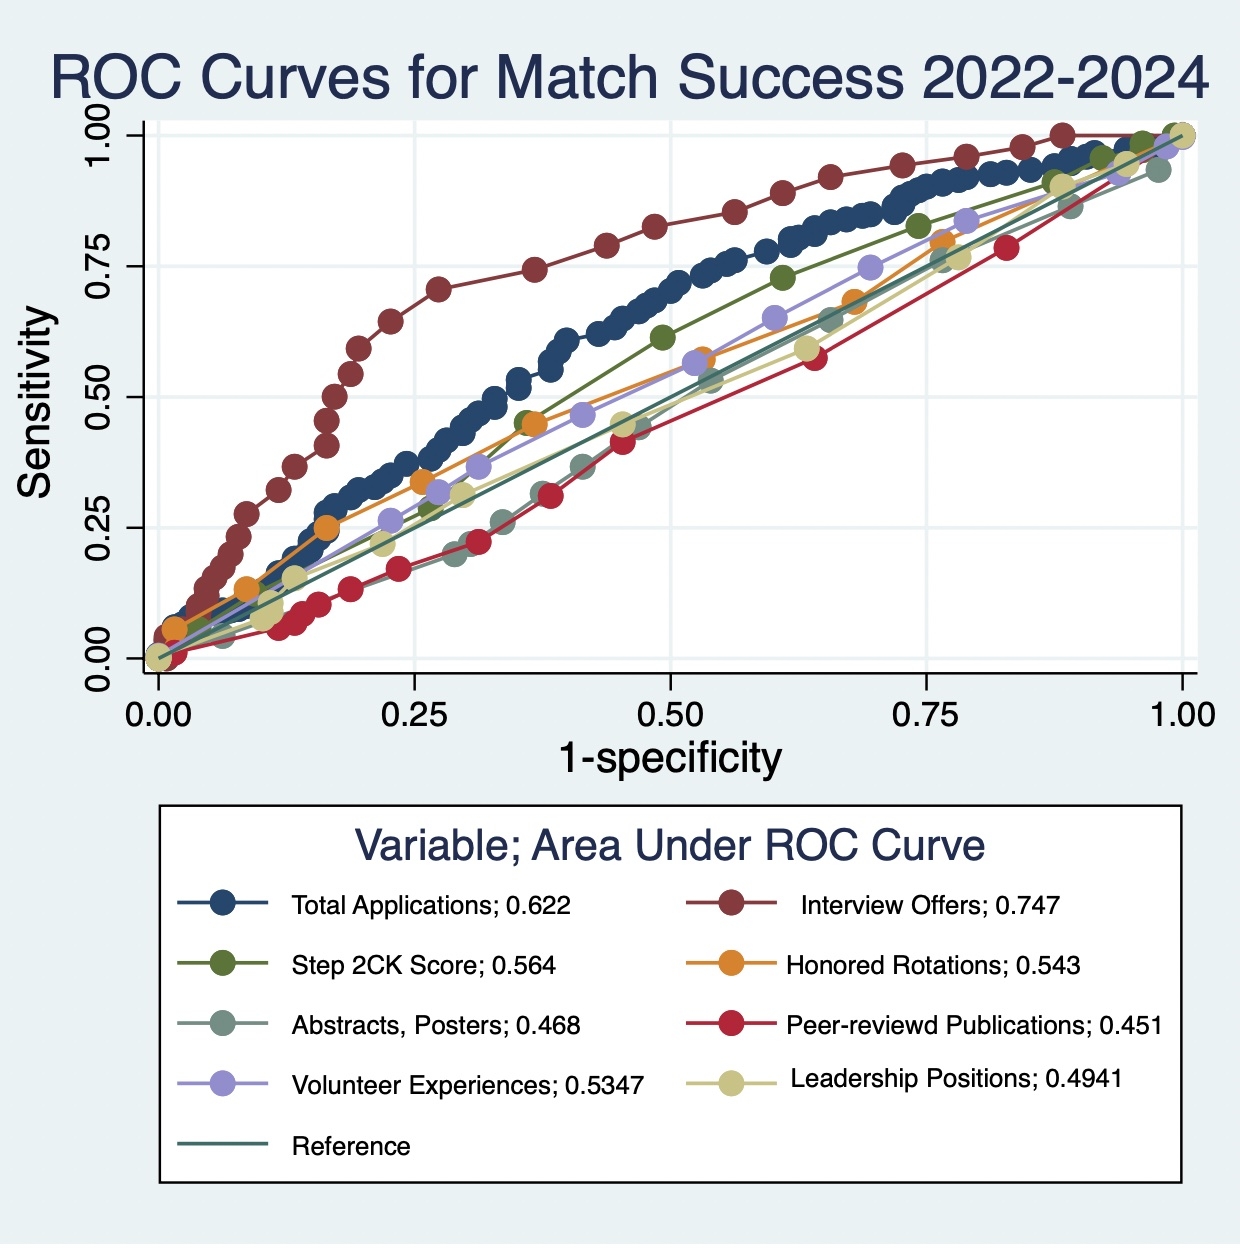
Results: From 2022-2024 (signaling years) 731/895 (81.7%) of students agreed to answer demographic questions. 442 (60.7%) were female. Average age was 27.4 years (Standard Deviation (SD): 2.55). 123 (16.9%) identified as under-represented in medicine (URiM). General respondent characteristics can be found in Table 1. 2022-2024 general surgery applicants submitted more applications on average (56.9 vs 52.3, p = 0.003) and received fewer interview invitations (14.3 vs 16.8, p <0.001) than 2017-2021 applicants. Interview offers were more evenly distributed among 2022-2024 applicants than they were among 2017-2021 applicants (p = 0.027). Applications with a geographic preference signal had significantly higher odds of receiving an interview offer (odds ratio (OR): 1.59, 95% confidence interval (CI): 1.51-1.68, p <0.001) and subsequently matching (OR: 2.18, 95% CI: 1.83-2.59, p <0.001). Those utilizing a preference signal had significantly higher interview (OR: 2.93, 95% CI: 2.71-3.18, p <0.001) and match odds (OR: 5.92, 95% CI: 4.93-7.10, p <0.001). Students completing an away rotation had significantly higher odds of interviewing (OR: 14.2, 95% CI: 11.6-17.4, p <0.001) and matching (OR: 15.2, 95% CI: 12.1-19.0, p <0.001) at the corresponding institution. 2022-2024 applicants that matched submitted significantly more applications, received significantly more interviewer offers, had significantly higher Step 1 and Step 2CK scores and significantly more peer reviewed publications (Table 2) than those that went unmatched. Of all analyzed variables, amount of interview offers received was most predictive of match success (area under ROC curve (AUC): 0.747) (Figure 1). URiM (OR: 0.833, p = 0.525) and male students (OR: 0.971, p = 0.890) were not significantly less likely to match.
Conclusions: The implementation of preference signaling in the general surgery residency application process appears to have increased average applications per student, decreased interview offers and more evenly distributed interviews among applicants. Away rotations, preference signals and geographic preferences seem to most strongly predict whether an application results in a successful match.
Table 1. Texas Seeking Transparency in Application to Residency Respondent Characteristics 2017-2024
| Variable | Mean | SD | 95% CI |
| Applications (mean) | 54.0 | 32.3 | 52.7-55.3 |
| Interview offers (mean) | 15.8 | 9.30 | 15.5-16.2 |
| Step 1 (mean) | 236.0 | 14.9 | 235.4-236.6 |
| Step 2 CK (mean) | 250.3 | 12.3 | 249.8-250.8 |
| Honored Clerkships | 3.26 | 2.41 | 3.17-3.36 |
| Abstracts, presentations, posters | 4.98 | 3.64 | 4.83-5.13 |
| Peer-reviewed publications | 2.58 | 2.92 | 2.46-2.70 |
| Volunteer experiences | 6.96 | 3.03 | 6.83-7.08 |
| Leadership experiences | 4.34 | 2.79 | 4.22-4.45 |
SD: Standard deviation, CK: Clinical knowledge, CI: Confidence interval
Table 2. Variables Affecting Applicant Success in 2022-2024
| Variable | Match (n = 766) (SD) | No Match (n = 141) (SD) | p-value |
| Mean applications | 59.0 (35.4) | 45.1 (33.7) | < 0.001 |
| Mean interview offers | 15.3 (8.56) | 8.67 (8.21) | < 0.001 |
| Mean Step 1 score | 236.9 (15.2) | 233.4 (14.4) | 0.022 |
| Mean Step 2 CK score | 251.4 (12.3) | 248.3 (13.3) | 0.008 |
| Mean honored clerkships | 3.27 (2.53) | 2.90 (2.29) | 0.107 |
| Mean abstracts, presentations, posters | 5.55 (3.71) | 6.07 (3.71) | 0.134 |
| Mean peer-reviewed publications | 2.95 (3.12) | 3.63 (3.56) | 0.021 |
| Mean volunteer experiences | 7.10 (3.13) | 6.73 (3.07) | 0.204 |
| Mean leadership experiences | 4.60 (2.86) | 4.59 (2.90) | 0.956 |
SD: Standard deviation, CK: Clinical knowledge
Back to 2024 Abstracts