Back to 2025 Abstracts
Widening the Gap: Financial Trends in Robotic versus Laparoscopic Sleeve Gastrectomy (2020-2023)
Suhas Suddala
*, Allison Crawford, Katharine P. Playter, Richard A. Perugini, James E. Carroll
University of Massachusetts Chan Medical School, Shrewsbury, MA
Robotic procedures are becoming increasingly prevalent in general surgery. It is debated whether robotic surgeries incur higher costs compared to laparoscopic methods. Companies and organizations have suggested that expenses associated with robotic procedures are expected to decrease over time, eliminating financial disparities between the two approaches. We reviewed the costs of robotic and laparoscopic sleeve gastrectomy (SG) to elucidate trends over time and evaluate these projections.
A retrospective analysis was conducted on surgical receipts from patients who underwent robotic and laparoscopic SG at a large, urban tertiary referral center. Surgical approach was determined via chart review and procedure-related charges were obtained from surgical receipts, which reflected total equipment-related expenses. Trends over time were analyzed using ANOVA, with significance threshold set at a p-value < 0.05.
Forty procedures were included in this study, comprising 20 robotic SG and 20 laparoscopic SG, evenly distributed with five cases per year from 2020 to 2023 in each group. The average cost associated with robotic SG increased over the four-year period, rising from $2722 to $4515. The costs associated with laparoscopic SG demonstrated more variability, increasing from $1710 to $2396 in the first year, then remaining consistent with a final average cost of $2481 in 2023. Specifically, the cost of robotic surgery increased at an additional $362 per year when compared to laparoscopic surgery (P<0.001) (Figure 1.)
Our findings suggest that costs associated with robotic SG are trending upwards, whereas laparoscopic SG costs have remained comparatively stable. Given that robotic techniques are already associated with increased costs, this upward trend may indicate a widening cost disparity between the procedures over the coming years. Further investigation is necessary to establish cost projections over the next decade and evaluate overall return on investment with SG robotic techniques.
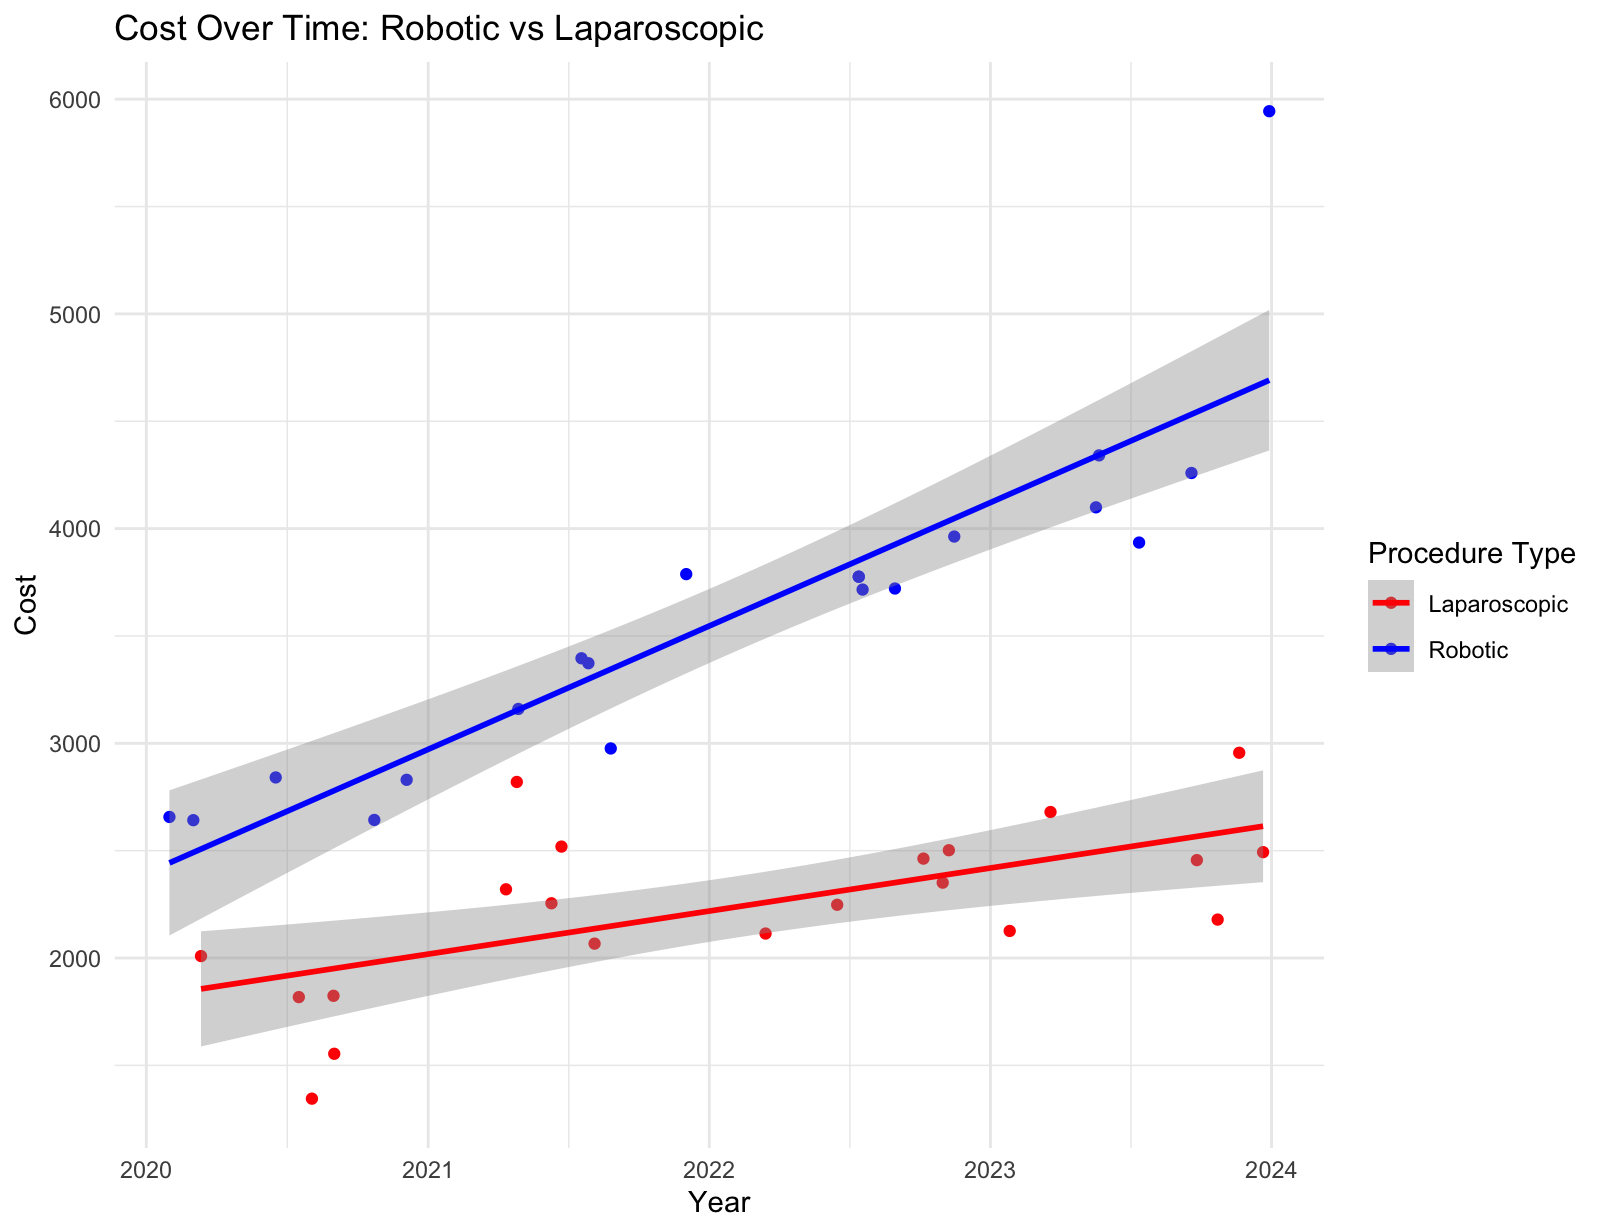 Figure 1.
 Individual procedural costs of robotic and laparoscopic SG plotted by surgery date from 2020 to 2023.
The data points represent the total cost of an individual SG case plotted on the date of surgery. Robotic cases (blue line) and laparoscopic cases (red line) are displayed with fitted trendlines. The shaded area represents a 95% confidence interval of the linear model.


