
Employing Objective Coagulation Assays to Personalize Postoperative Management in Peripheral Artery Disease
Monica Majumdar, Zach Feldman, Imani McElroy, Davis Waller, Srihari Lella, Anahita Dua
Division of Vascular & Endovascular Surgery, Massachusetts General Hospital / Harvard Medical School, Boston, Massachusetts, United States
Background/Objective
Peripheral artery disease (PAD) is endemic in our globally aging population with >202 million affected worldwide. Graft and stent thrombosis after lower extremity revascularization is common, and a leading cause of amputation and major adverse cardiovascular events (MACE) such as myocardial infarction, stroke and death.
Optimizing medications to decrease thrombosis is of paramount clinical importance, however we have limited guidance on how to utilize and monitor therapy in this heterogeneous population. Thromboelastography with Platelet Mapping (TEG-PM) is an emerging point-of-care technology and may be integral to the next stage of patient-centered thrombophrophylaxis. This prospective observational study aimed to determine if TEG-PM could predict thrombosis following lower extremity revascularization.
Methods
All patients undergoing lower extremity revascularization between December 2020 and January 2022 at a large tertiary institution were eligible for enrollment. Patients were followed for the primary outcome of graft/stent thrombosis for up to one year. TEG-PM assays were collected preoperatively and at serial intervals postoperatively, at one, three and six-month intervals. Inferential analysis was performed to determine differences in those patients with thrombotic events as compared to those without. Cox proportional hazards (PH) regression analysis explored the association of thrombosis and TEG-PM parameters. Cut-point analysis to define patients at high-risk for thrombosis was performed by creating receiver operating characteristic (ROC) curves.
Results
Of the 100 patients analyzed, 20% experienced a thrombotic event. There was no statistically discernable difference in the use of antiplatelet therapy between groups. The thrombosis group had significantly higher platelet aggregation [78.4%±20.0 vs. 58.9%±23.6, p<0.01] and lower platelet inhibition [18.7%±17.1 vs. 40.6%±23.8, p<0.01] (Table 1). Cox PH analysis identified platelet aggregation as an independent and consistent predictor of events [HR=1.06, 95% CI 1.02-1.10, p<0.01]. Cut point analysis revealed the diagnostic viability of using viscoelastic metrics for prediction of thrombosis, with values of >70.8% platelet aggregation or <29.2% platelet inhibition identifying those at high risk of thrombosis with 90.0% sensitivity and 73% specificity (Figure 1).
Conclusions
Antithrombotic therapy is the cornerstone of graft/stent maintenance after surgery for PAD, yet thrombosis is frequent and often results in amputation. A quantitative and subject-specific approach is integral to improving rates of limb salvage. Using objective viscoelastic testing we found high platelet aggregation and low platelet inhibition to be independent and consistent predictors of thrombosis. Based on the cut-points of >70.8% platelet aggregation and <29.2% platelet inhibition, an antithrombotic step-up approach to achieve optimal platelet activity may decrease the risk of thrombosis.
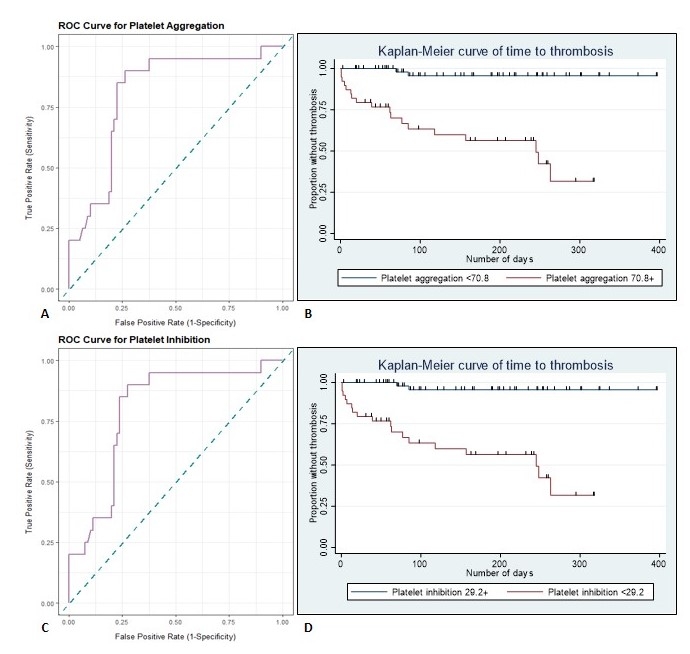
Figure 1. Cut point analysis for (A) Platelet Aggregation: receiver operating characteristic (ROC) curve analysis [AUC=0.808, 95% CI: 0.704-0.911] with (B) Kaplan-Meier visualization of thrombotic risk for >70.8% aggregation over time and (C) Platelet Inhibition: ROC curve analysis [AUC=0.798, 95% CI: 0.694-0.903)] with (D) Kaplan-Meier visualization of thrombotic risk for <29.2% inhibition over time.
Viscoelastic assay values between nonevents and events.
| No event N/mean (%/SD) | Thrombosis N/mean (%/SD) | P | |
| Total patients | 80 | 20 | |
| TEG values | |||
| R time | 7.6 (±3.0) | 9.1 (±4.0) | 0.08 |
| K time | 1.9 (±1.3) | 1.7 (±1.2) | 0.64 |
| alpha-angle | 68.9 (±9.9) | 66.6 (±13.7) | 0.39 |
| MA | 62.0 (±8.7) | 65.53(±6.9) | 0.13 |
| Platelet Mapping values | |||
| % ADP Platelet aggregation | 58.9 (±23.6) | 78.4 (±20.0) | <0.01 |
| % ADP Platelet inhibition | 40.6 (±23.8) | 18.7 (±17.1) | <0.01 |
Back to 2022 Posters