
The Effect of the Business Cycle on the Living Organ Donation Rate: Evidence and Implications
Sean S Lee1, Michael W Sielski2, Kevin P Charpentier3,1
1The Warren Alpert Medical School of Brown University, Providence, RI;2Brown University, Providence, RI;3Department of Surgery, Rhode Island Hospital, Providence, RI
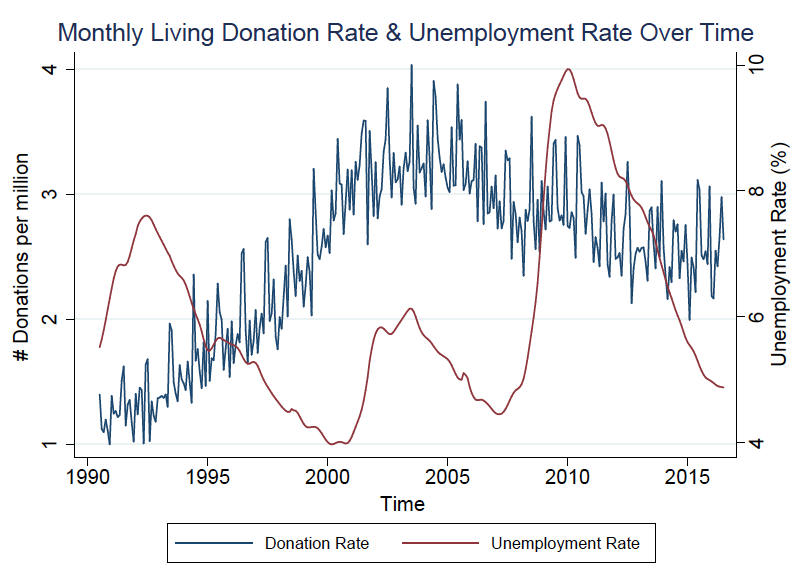
Objective: We study the contribution of the economic environment to an individual's decision to donate an organ by examining the relationship between the unemployment rate, a commonly used indicator of macroeconomic health, and the living donation rate. We test the hypothesis that economic downturns may reduce the living donation rate by causing financial and emotional distress among potential donors. Design: Retrospective cohort study. Setting: General community. Patients: 120,662 donations from living, working-age donors. Interventions: None. Main Outcome Measure(s): Estimates from regression of living donation rates on the unemployment rate. Results: Graphical analysis reveals that, unlike the unemployment rate, the donation rate is non-cyclical over time, implying little correlation between the two factors (Figure 1). This motivating evidence is corroborated by regression models using state and calendar month fixed effects, where we find no significant association between the unemployment and donation rates (Table 1). Our analysis finds that this pattern holds even when restricting to demographic groups that may be impacted more significantly by the unemployment rate. Conclusions: Our findings indicate that the unemployment rate is not associated with the donation rate, suggesting that the economic environment plays a minimal role in the decision to donate.
| Table 1: Effect of the unemployment rate on the living donation rate (per million), fixed-effects model | |||||||
| (1) | (2) | (3) | (4) | (5) | (6) | (7) | |
| All | Working-age | Working-age females | Working-age males | Working-age whites | Working-age non-whites | Ages 65 and up | |
| Effect of unemployment | 0.009 | 0.018 | 0.026 | 0.009 | 0.063 | 0.060 | 0.004 |
| (standard error) | (0.019) | (0.031) | (0.039) | (0.034) | (0.035) | (0.132) | (0.012) |
| Average living donation rate (per million) | 1.53 | 2.64 | 3.13 | 2.14 | 2.93 | 3.78 | 0.17 |
| [standard deviation] | [1.07] | [1.90] | [2.74] | [2.22] | [2.11] | [6.91] | [0.94] |
| Notes: The unit of observation is the state-month. Each column represents a different sample used when constructing the living organ donation rate. Specification (1) uses all donors. Specification (2) uses the working-age population, where the working-age population is defined as persons between the ages of 25 and 64, inclusive. Specifications (3) and (4) repeat specification (2) restricting the sample to females and males, respectively. Specifications (5) and (6) repeats specification (2) for whites and non-whites, respectively, and restricting t to be between July 2000 and July 2016. Specification (7) uses the population of individuals ages 65 and up, inclusive. In all specifications, the living organ donation rate is calculated as the total number of living organ donations from the population of interest divided by the number of a million of people in that population of interest. The first row reports the coefficient on the unemployment rate from a two-way fixed-effects regression model with controls for state and calendar month. In all specifications, the unemployment rate for each state-month is calculated as the total number of unemployed divided by the number of people in the labor force, multiplied by 100. The second row reports the standard error on this coefficient. Standard errors are clustered by state and calendar month. The third row reports the number of observations in the estimation sample. The fourth row reports the mean donation rate among the estimation sample. The fifth row reports the standard deviation of this mean. | |||||||
Back to 2019 Posters


